AI shift brief
An agent summarises what changed, what is at risk and the recommended action — every hour.
An AI control tower for an automotive parts supplier: one live view of plants, suppliers, lanes and orders, with AI that spots disruptions early, sizes the impact and ranks the response before a line stops.
Warehouse digital twin · illustration
Watch Locus Meridian, our supply chain control tower, take a disrupted morning from the first warning to an approved response: every screen, the AI agent and the people making the call.
How separate signals become a single decision, before the line stops. Illustrative scenario from the platform’s sample data.
A supplier confirms it can ship 1,900 of 6,400 castings after losing a furnace overnight.
A customer plant raises its December release by 12%, widening the gap.
Port congestion adds 2.9 days to an inbound ocean lane.
The agent reroutes six border loads; the truck queue drops to nine.
The shift brief puts $9.9M at risk and a line stop 31 hours out, and recommends air freight from a sister plant for $184k. Planners compare three options and approve.
Built for operators in a control room and readable across the room on a wall display. Select a marker.
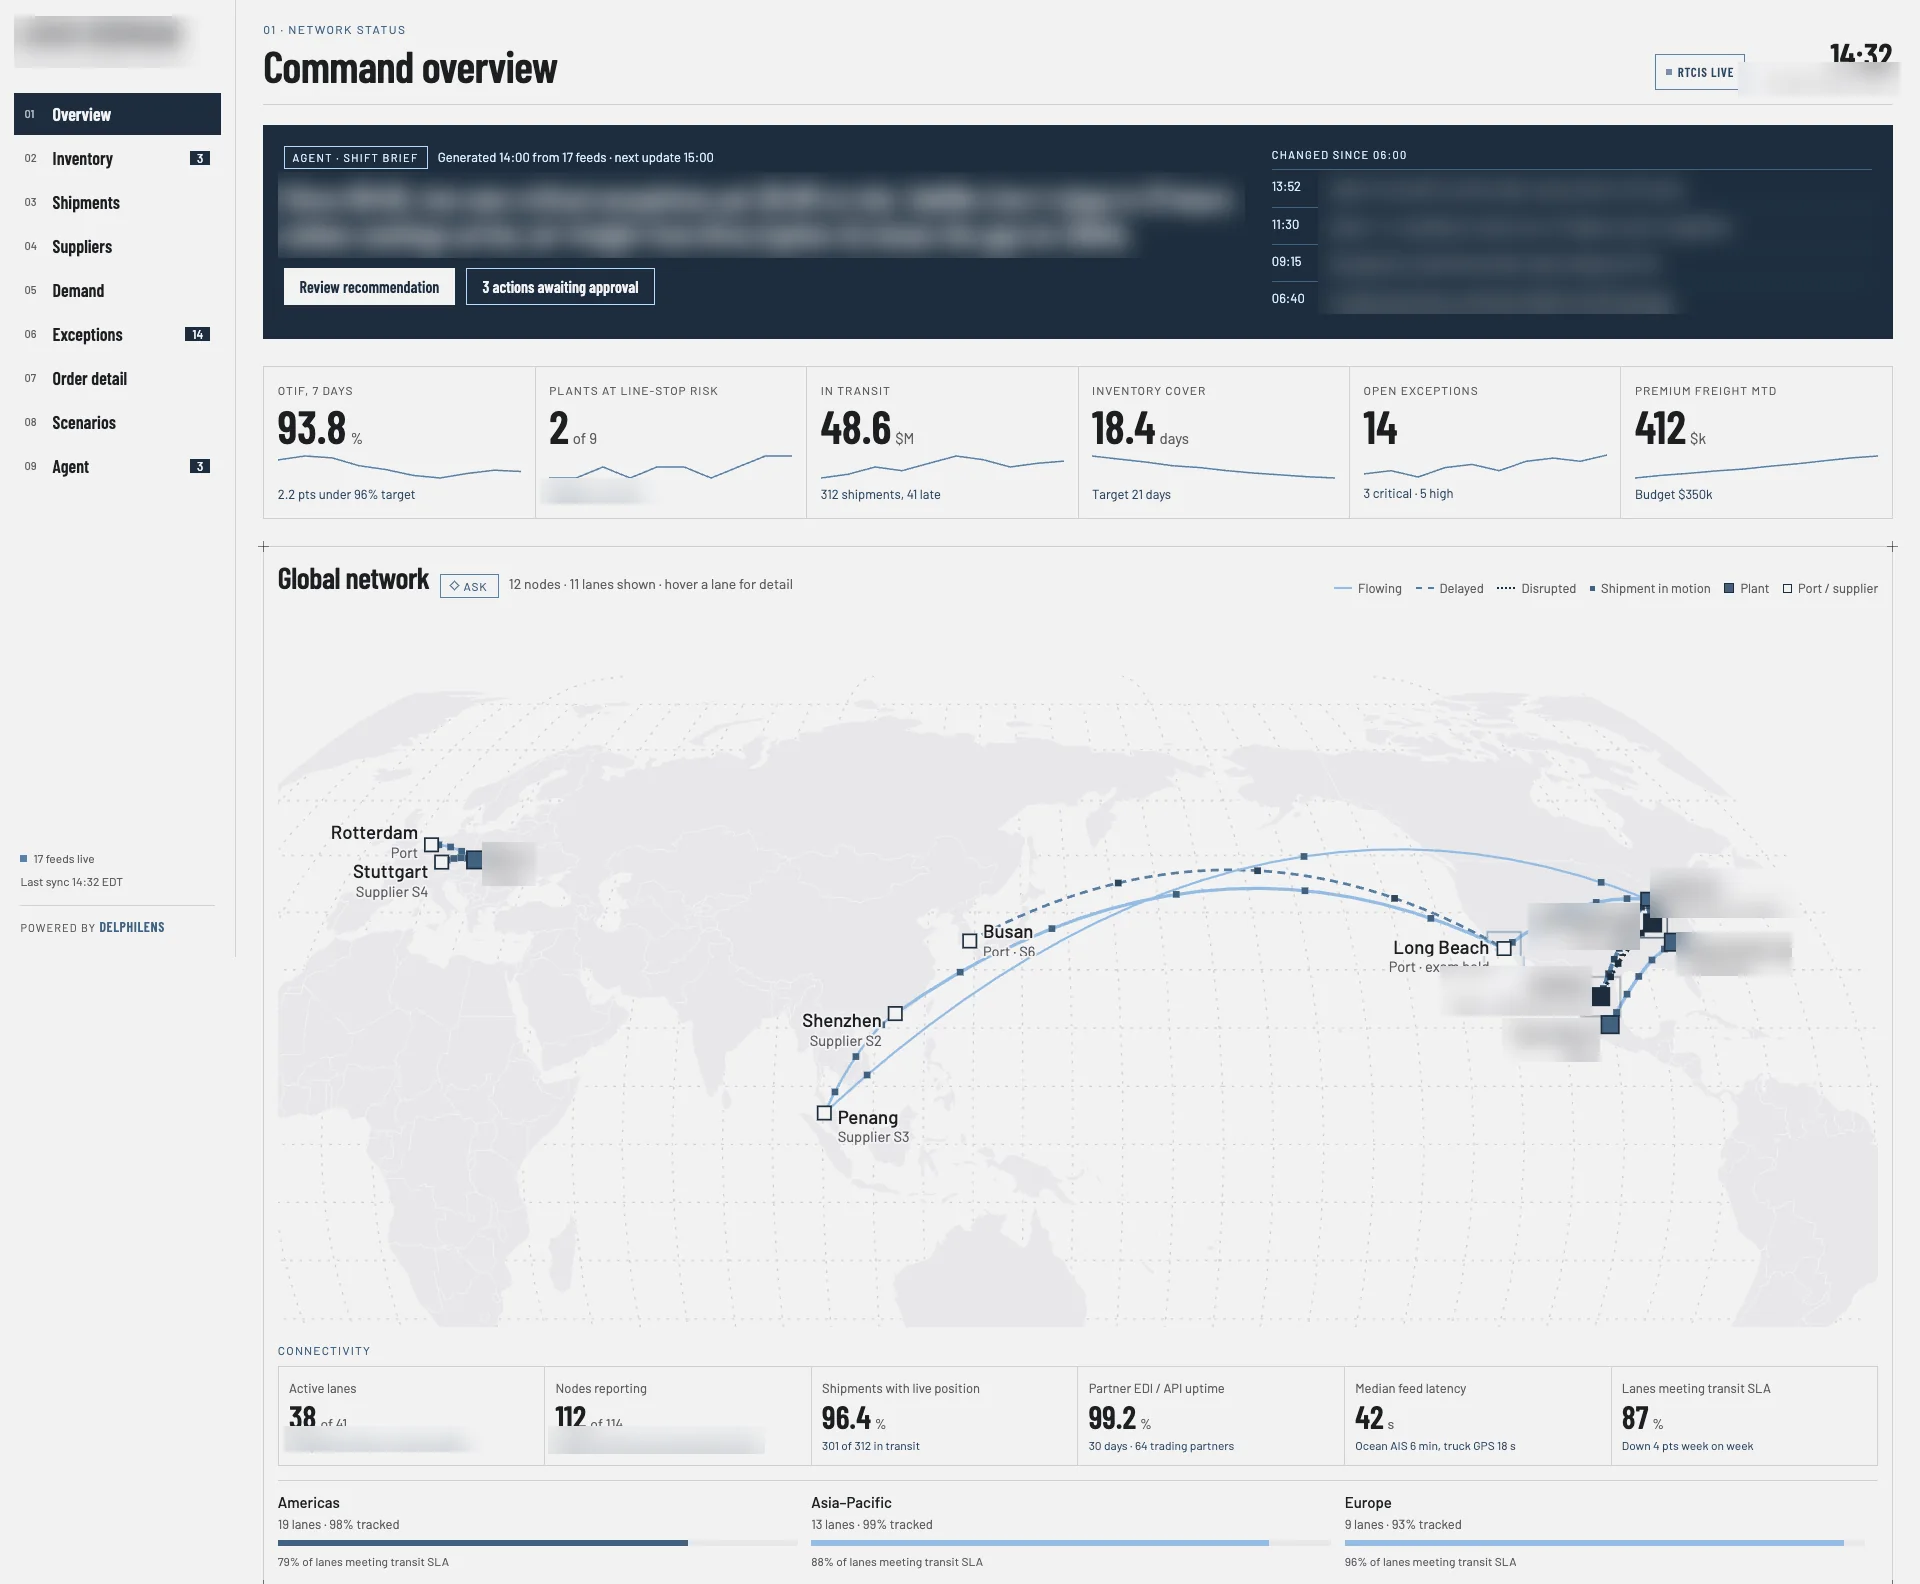
What changed since 06:00, what is at risk and the recommended action, refreshed hourly from every feed.
OTIF, line-stop risk, value in transit, inventory cover, exceptions and premium freight, each with a trend.
Shipments move along each lane at a speed set by mode and slow on delayed lanes; stressed sites pulse.
Flowing, delayed and disrupted lanes at a glance, with tracking coverage on hover.
Feeds reporting, live positions, partner uptime and latency — so operators know what to trust.
Lanes, tracking and SLA performance for the Americas, Asia-Pacific and Europe.
Every view shares the same live data, so an incident reads as one connected story from the overview to the response.
Headline metrics and the live network map.
Days of cover against target at every site.
Ocean, truck, air and rail with milestones and customs holds.
Likelihood-by-impact matrix with warning signs.
Forecast and uncertainty band against committed supply.
A queue ranked by revenue at risk.
Penalty exposure, delivery path and allocated stock.
Options compared on line-stop hours, cost and service.
Every feed is cleaned into one shared model of the network, checked for freshness and coverage, and used for forecasting, risk scoring and the agent. Operators approve every action.